Know when each part runs out, on your bike, from your riding
Manufacturer intervals assume an average rider on an average road. Componentry replaces them with a model built from your rides: the climbing, the power, the weather, the distance. Every figure it produces is marked so you can tell a projection from a record.
Start your 2-month free trial. No credit card required.
Chain · Sunday bike
Example bike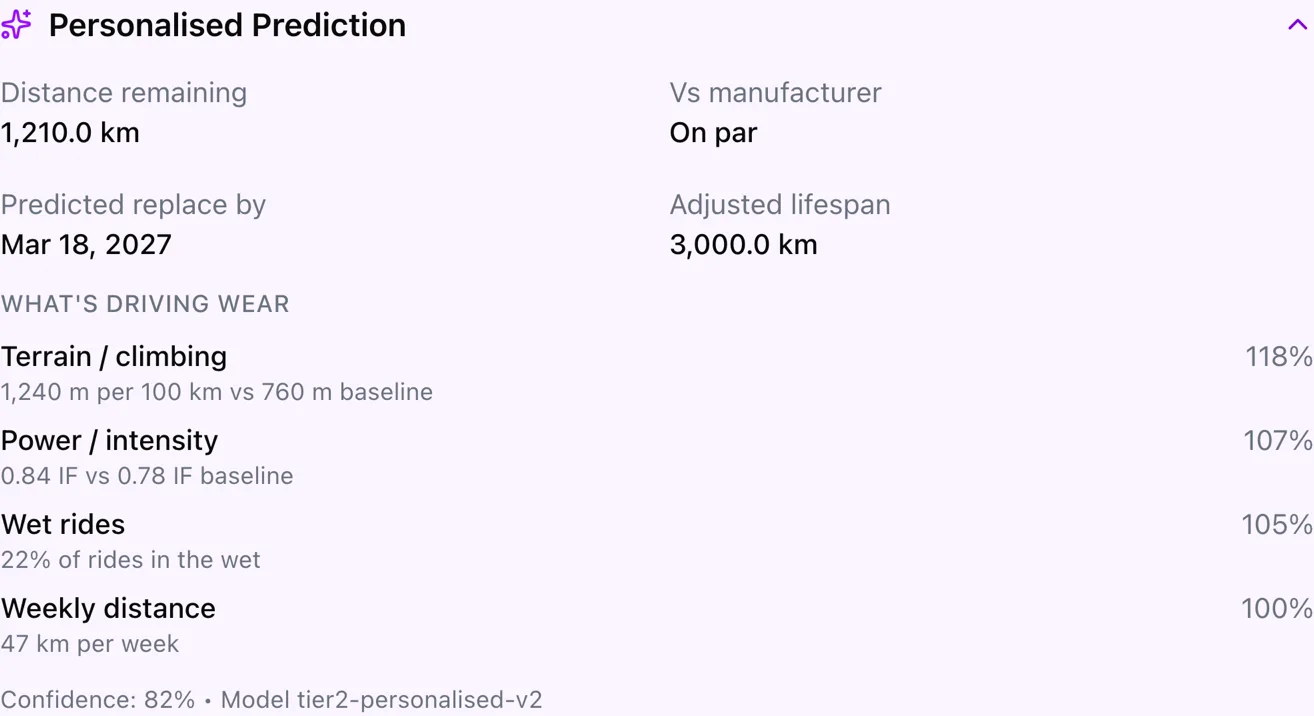
Your distance, your wear
The same distance in the hills wears a drivetrain differently to the flat. Componentry reads every ride's terrain, power, and weather and turns them into a wear rate that is yours, then shows what is multiplying it.
A wear rate built from your rides
Climbing, power, descending, weather, and volume each carry a factor. The list is sorted by effect, so the thing driving wear on your bike is at the top.
The headline figure is the strongest signal
When the model knows more than the manufacturer rating, the prediction leads. The measure behind the figure is always named: Distance, Duration, Time, or Predictive.
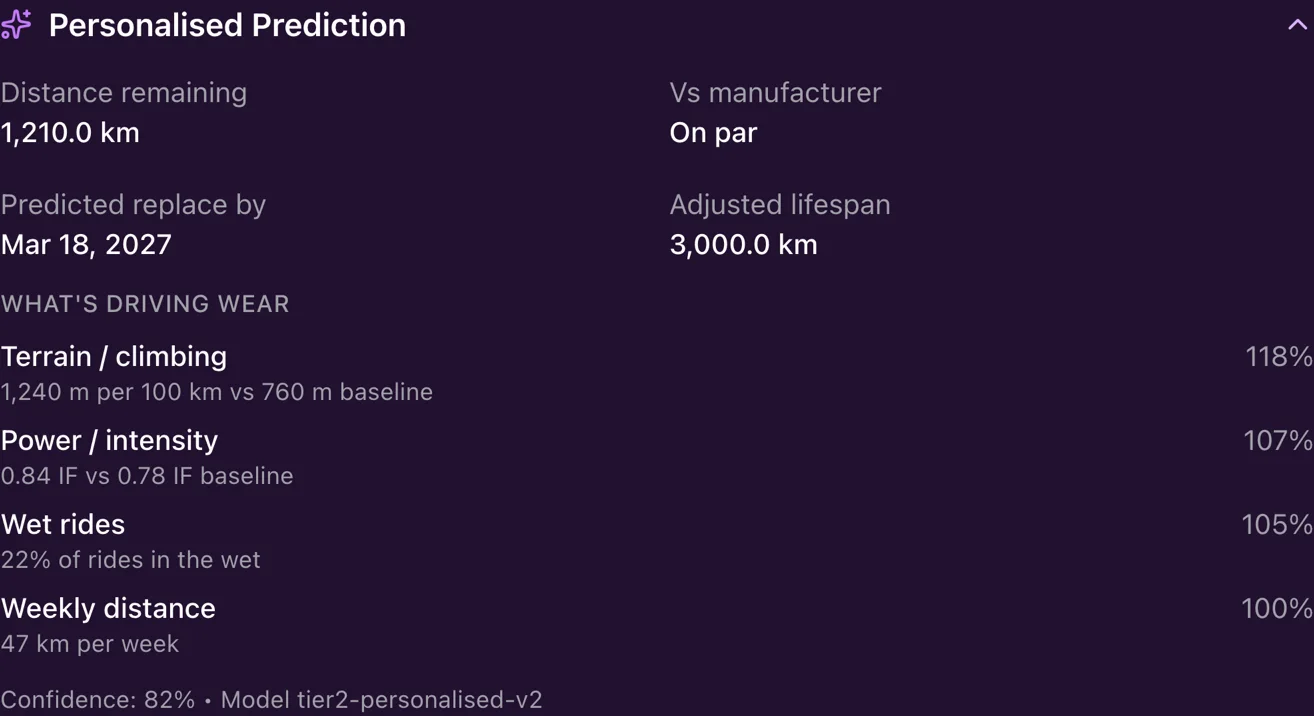
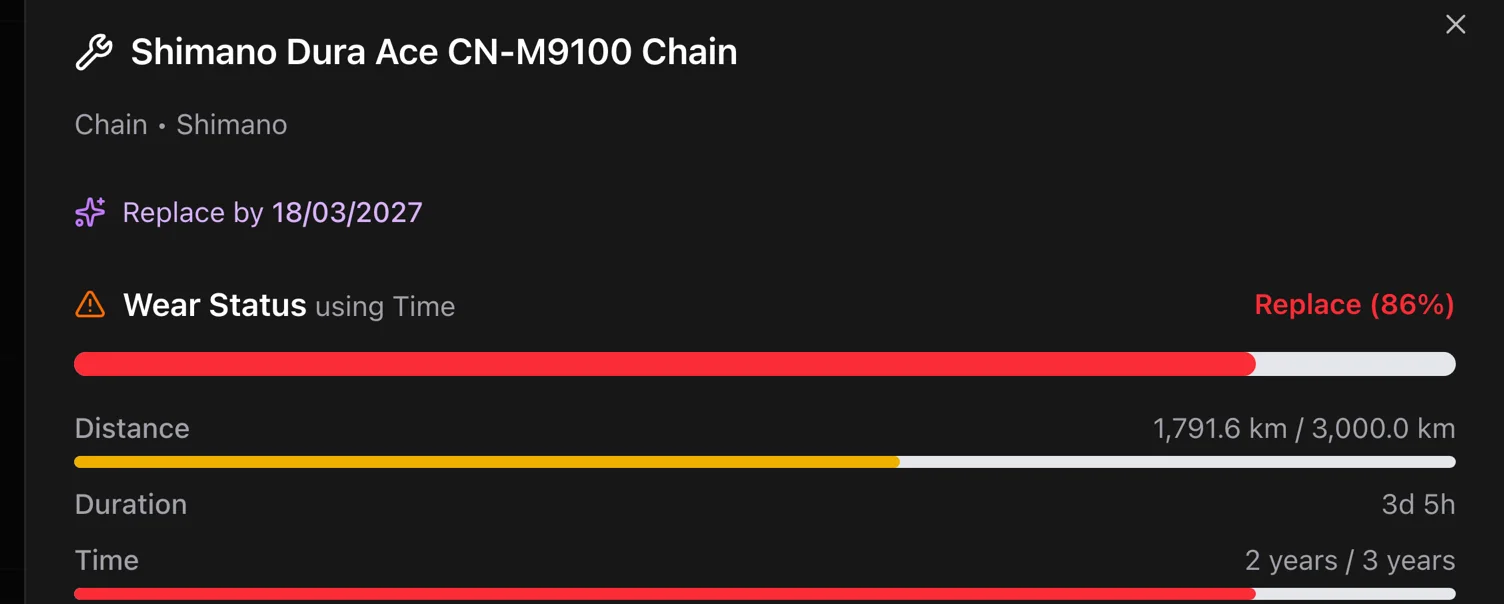
Web and phone agree
The same prediction, the same confidence, the same factors on componentry.app and in the app. There is one model, not two.
Good to know. Predictions are marked purple everywhere they appear so a modelled figure is never mistaken for a measured one. Confidence and the model version are shown on every prediction.
A date, not a percentage
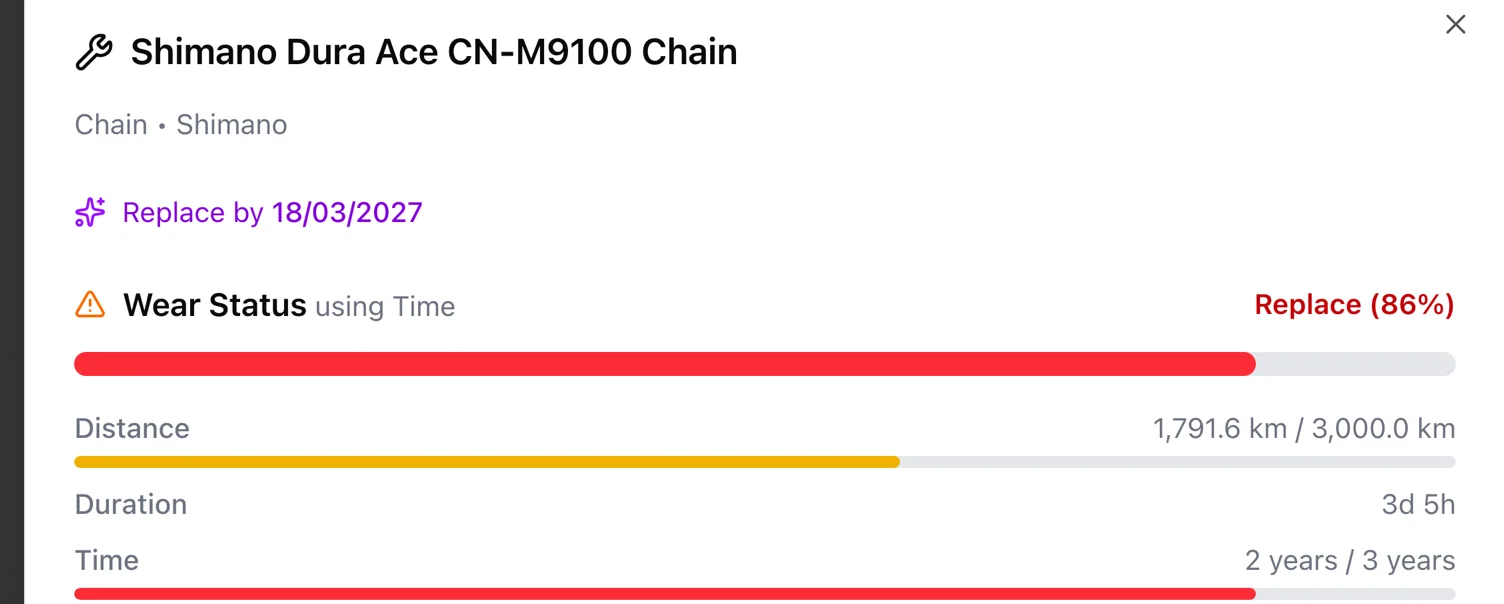
A wear percentage answers how used a part is. A replace-by date answers the question you actually have. Componentry projects the date from your current rate and keeps it honest about how far it can see.
Distance remaining and the date it lands
Each component shows what is left and when, at your rate, it runs out.
Cards lead with the answer
Prediction cards open collapsed on the figure. Expand one for the provenance: what was measured, what was assumed, and how confident the model is.
Refuses false precision
Sub-watt figures collapse to under one watt and far-off dates round to years. Naming what is not known is part of the model.
Good to know. Dates appear when they fall within two years. Beyond that Componentry shows 2+ years instead of inventing precision it does not have.
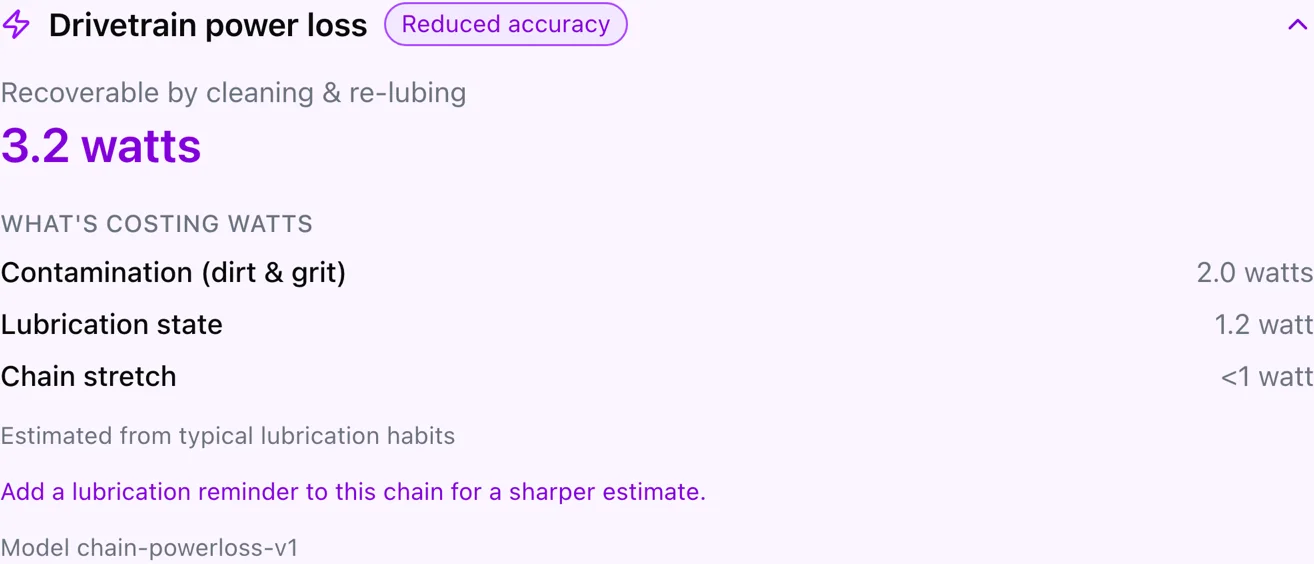

What your chain is costing you, in watts
A dirty, dry, or stretched chain turns your effort into heat. Componentry models the loss from contamination, lubrication state, and stretch, and separates what a clean, freshly lubricated chain gives back from what only a new chain fixes.
Loss and recoverable, side by side
The band on your bike card shows the total and the share you can get back with a clean and lube. The gap between them is stretch, which only a replacement removes.
Wax-aware
Mark a chain as waxed in a service note or check and the model treats it accordingly. Waxed or lubricated shows on the component list.
Sharpened by your service records
A lubrication reminder and your chain stretch readings feed the model, so the estimate tightens as you record what you do.
Good to know. Works with a connected bike computer, and with Strava-only rides at reduced accuracy. Sub-watt figures read as under one watt. The chip disappears when there is nothing to recover.
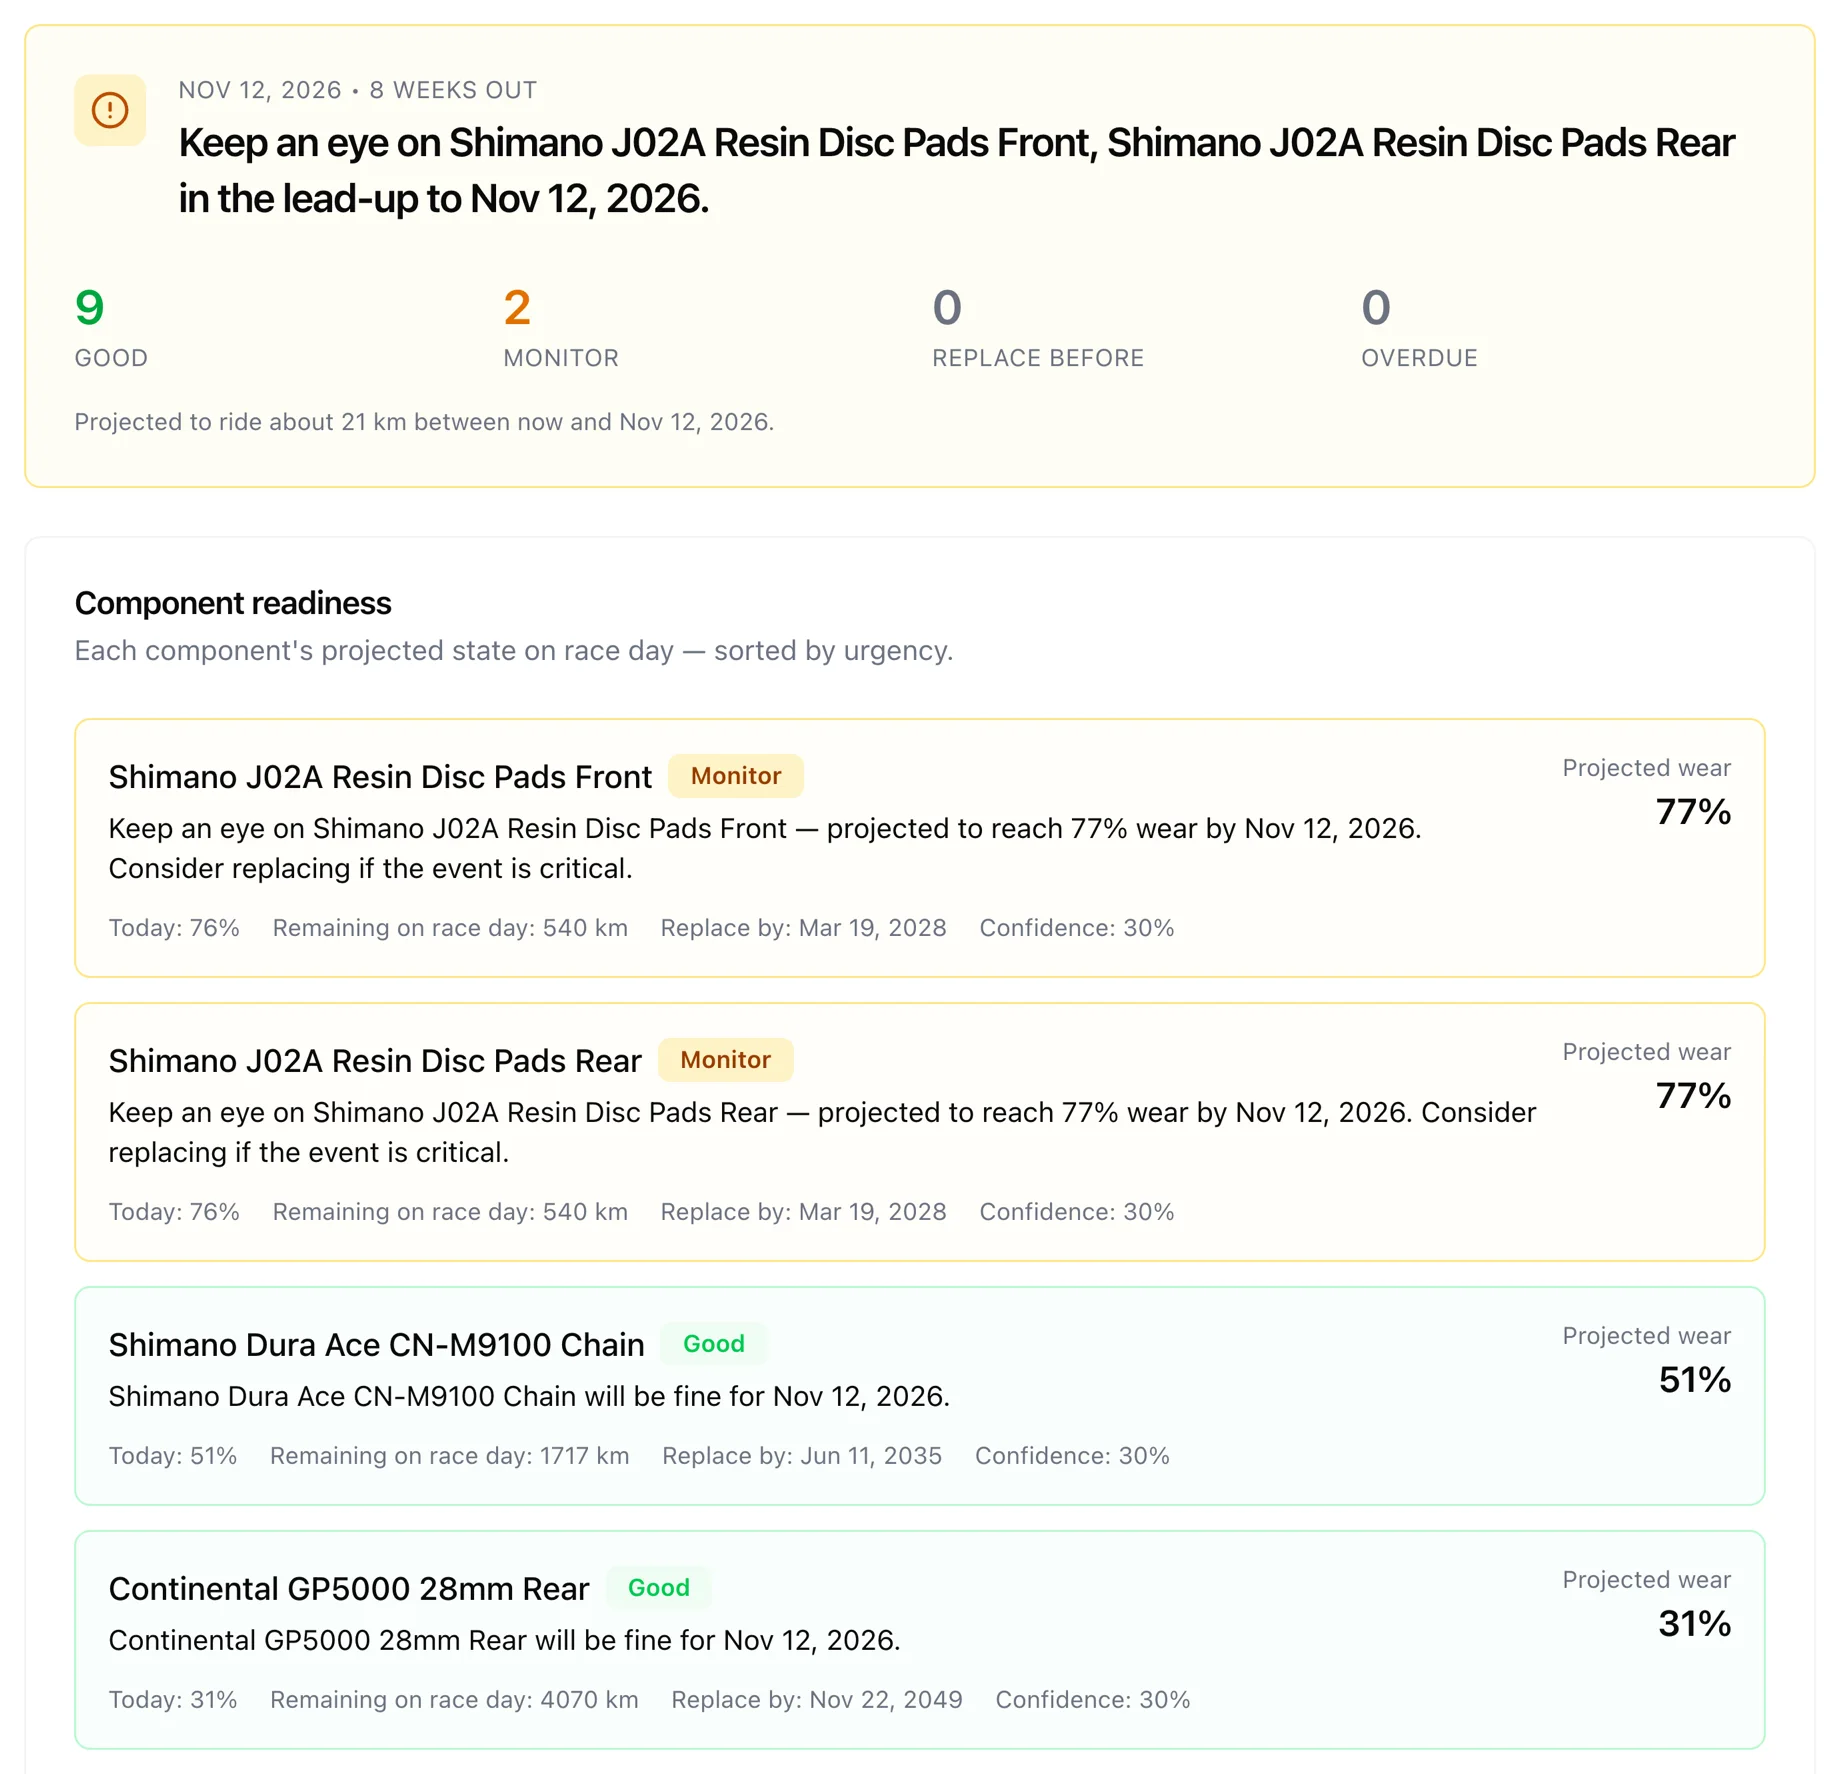
Show up race-ready
Pick the date and the plan you are on, and Componentry projects every component to the start line. What will be fine, what will be marginal, and what to replace before the gun goes.
Training-plan presets
Normal, Build, 2-week taper, and 4-week taper change how much riding the model expects between now and the day.
Per-component readiness
Each part gets its own projection on the date, so a chain that is fine and a set of pads that is not are not averaged into one number.
Per-profile forecasting
Race wheels and training wheels wear differently. Pick the profile you will ride and the forecast follows it.
Good to know. Race-day readiness is profile-aware: forecast a specific setup, all of them, or components with no profile. Every readiness card lists what it assumed.
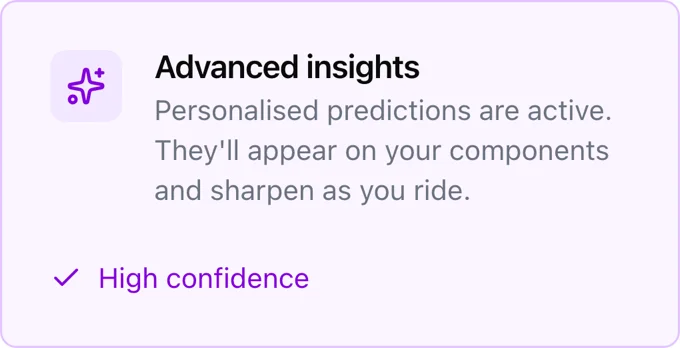

How predictions unlock
The model needs real riding to be worth trusting. Componentry shows you where you are on the way to each tier and what a connected bike computer adds.
Progress you can see
A meter on the dashboard counts the rides toward the next tier and says what it unlocks.
Bike computer data goes deeper
Power, cadence, and terrain from ride files sharpen wear rates and chain power loss beyond what a ride summary can.
Strava power counts too
When a head-unit ride is paired with its Strava copy, the Strava power feeds the chain model.
Good to know. Basic predictions work from synced rides. Advanced insights use ride files from a connected Garmin, Wahoo, or Hammerhead computer, or .FIT uploads.
More of what Componentry does
All featuresQuestions riders ask
How does Componentry calculate component wear?
How accurate are the wear predictions?
What data does Componentry need to get started?
What is a digital twin for a bike?
Stop guessing. Start knowing.
Connect your rides and the first predictions arrive as the model learns how you ride.
Start your 2-month free trial. No credit card required.