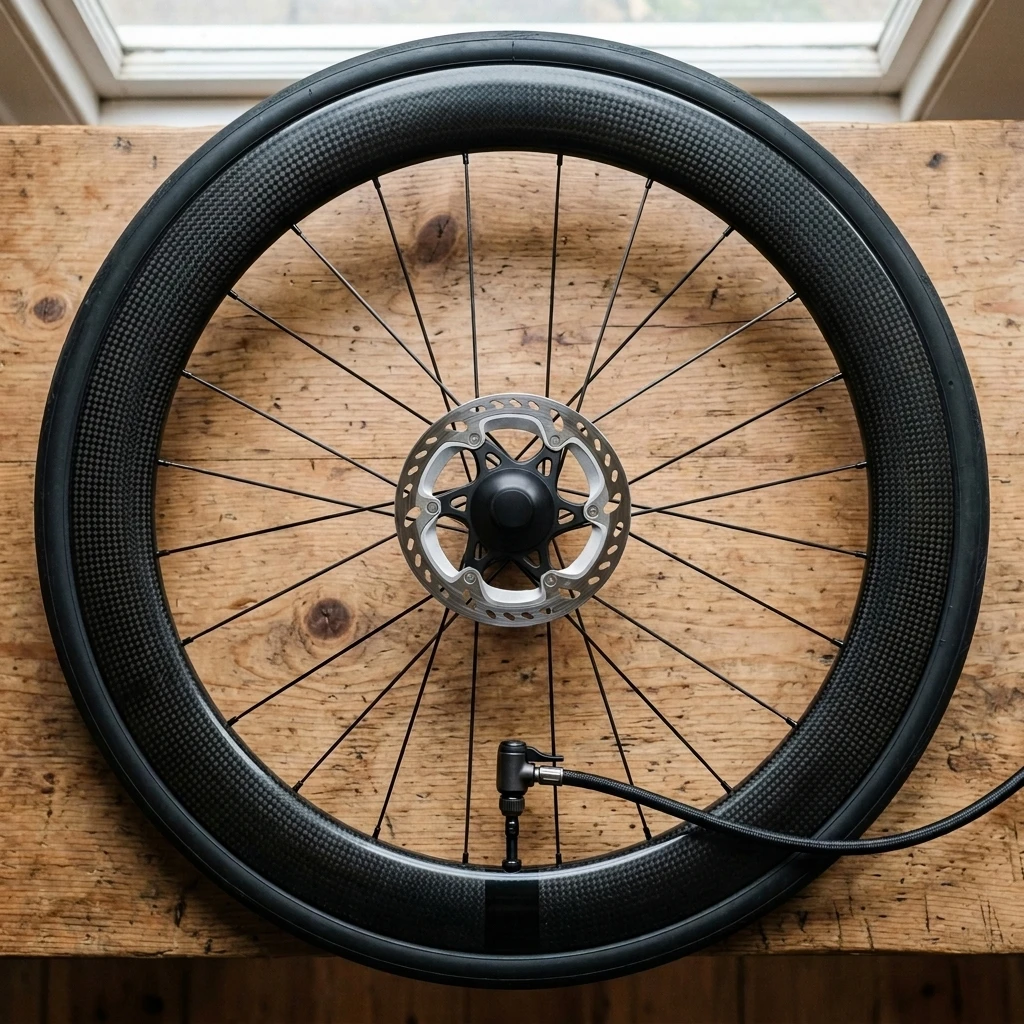


There is one change you can make to your bike that costs nothing, takes two minutes, and is worth more watts than most of the upgrades people spend real money on. It is your tyre pressure. Most riders get it wrong, and they get it wrong in the same direction: too hard.
The reason is straightforward. The pressure moulded into your tyre's sidewall is a safety limit set by the manufacturer, the point past which they will no longer vouch for the tyre staying on the rim. It was never a recommendation, and it has nothing to do with how fast you will roll. Somewhere along the way the industry taught a generation of cyclists to pump to the sidewall and stop thinking about it.
The number that actually makes you faster depends on your weight, your tyre's measured width, the surface you ride on, and how quickly you cover it. That is four moving parts, which is why the answer comes from a calculator rather than a rule of thumb.
Two Ways a Tyre Loses Your Energy
A tyre bleeds your power in two separate ways, and they pull in opposite directions.
The first is casing loss. Every time a section of tyre rolls into the contact patch it deforms, and the rubber and casing threads flex against each other. That flex generates heat, and the heat is energy you paid for. Lower pressure means a larger contact patch and more deformation per revolution, so casing losses rise as pressure falls. This is the loss mechanism that steel-drum lab testing measures, and on a perfectly smooth drum the conclusion is exactly what conventional wisdom says: harder is faster, all the way up.
The second is impedance, sometimes called suspension loss. Roads are not steel drums. Every crack, chip, and stone in the surface has to be absorbed by something, and the candidates are the tyre, the bike, and you. A tyre that is soft enough to deform around a road irregularity absorbs it cheaply. A tyre that is too hard to deform passes it up into the frame and the rider instead, where it is dissipated as vibration in your body and the bike's structure. That energy is gone, and there is a lot more of it than most cyclists assume.
Add the two curves together and total rolling loss stops being a straight line. It falls as pressure rises, reaches a minimum, then climbs again as impedance takes over. SILCA calls that minimum the breakpoint pressure, and it is the number a pressure calculator is trying to find for you.
Where the Breakpoint Number Came From
The reason SILCA's calculator carries weight is that the underlying data was gathered on real roads, not in a lab.
In the summer of 2014, SILCA's team took advantage of a local repaving project that closed roughly 900 metres of road, and ran pressure sweeps on it using the Chung method — a technique for deriving rolling resistance coefficients from real-world ride data. The same rider on the same bike, a Cervélo P4 at around 190 lb of total system weight, on 25mm Continental GP4000S II tyres that measured 25.8mm on Zipp 404 Firecrest wheels.
What made the site useful was that the repaving gave them four genuinely different surfaces in the same place: milled pavement with roughly 8mm of peak-to-valley roughness, chip seal, coarse asphalt, and the finished surface. Same rider, same tyres, same day, four road textures. The breakpoint moved with the surface exactly as the impedance model predicts.
One detail from that work is worth keeping in mind the next time you ride a road you think you know: four-day-old pavement measured higher rolling resistance than the identical surface two years later. Roads change under you, and so does the pressure that suits them.
The Penalty Is Not Symmetrical
This is the part that should change what you do at the pump, and it is the reason guessing low beats guessing high.
The curve either side of the breakpoint is not a mirror image. SILCA's testing puts the cost of running 10 psi below the breakpoint at roughly one watt. Running 10 psi above it costs around nine. Tighten the window to 5 psi and the shape holds: about one watt under, three to four watts over.
"It is always better to be too low than too high."
Most riders, aiming at a number they half-remember and using a pump gauge they have never checked, land on the expensive side of that asymmetry.
There is a floor, though, and on rough surfaces it is not measured in watts at all. Go far enough under and you stop losing efficiency and start risking pinch flats, burped tubeless sealant, and rim damage. SILCA's own framing of the cobbled classics makes the point bluntly: a few psi over optimum on cobbles simply makes you slower, while a few psi under can put you on the roadside waiting for a spare wheel. The asymmetry runs one way on smooth roads and the other way on rough ones, which is precisely why a calculator that asks about your surface beats one that doesn't.
It Is Not Only About Watts
Rolling resistance gets the headlines because it is measurable, but two other things move with pressure and both matter more than a handful of watts on a long ride.
Grip. A contact patch that is being bounced clear of the road surface by vibration is not gripping it. On chip seal, gravel, or cold wet tarmac, over-inflated tyres skitter where correctly inflated ones track.
Fatigue. The vibration that impedance losses describe does not disappear when it reaches you. It arrives as road buzz in your hands, arms, and back, and after four hours it has a real cost in how much power you can still produce. Riders who drop to a properly calculated pressure for the first time usually report the comfort before they notice the speed.
SILCA Is Not the Only One Who Found This
It is fair to be sceptical of physics research published by a company that sells pumps. The useful check is whether anyone reached the same conclusion independently, and they did.
Jan Heine and the team at Bicycle Quarterly arrived at the same place from a different direction, running real-world roll-down and power testing and coining the term suspension losses for what SILCA calls impedance. Their finding was the same: in the lab, higher pressures roll faster; on the road, suspension losses rise with pressure and cancel the gain. That work has since been replicated and confirmed by others, including on surfaces smooth enough that conventional wisdom said it shouldn't matter.
Two research programmes, different methods, different commercial interests, same answer. That is about as close to settled as cycling tech gets.
What a Calculator Needs From You
SILCA's Pro Tire Pressure Calculator is the most rigorous public tool for this, and it is the one we point riders at rather than building a lesser version of our own. Our tyre pressure resource page has the short version of why it matters and a direct link to the tool.
Before you open it, two of its inputs are worth preparing properly, because they are where riders quietly hand themselves a wrong answer.
Measured width, not printed width. A tyre labelled 28mm can sit anywhere from 28 to 31mm depending on the internal width of the rim it is mounted on, and modern rims have grown considerably. Two millimetres of extra width is a meaningful change in air volume, and air volume is what the calculation runs on. Measure the mounted tyre with calipers, at pressure, rather than reading the sidewall.
A pump gauge you have reason to trust. SILCA's own note on this is worth repeating: many floor pump gauges are 5 to 8 psi out even when new. Given that 10 psi over the breakpoint costs around nine watts, a gauge reading 8 psi optimistic can erase the entire benefit of doing the calculation in the first place. If you have access to a second gauge, compare them.
The rest of what it asks for is straightforward: total system weight including you, the bike, and anything you are carrying; the surface, from indoor track through to rough gravel; a realistic average speed; your tyre's construction; and the front-to-rear weight split for your bike type, since front and rear tyres do not carry the same load and should not run the same pressure.
Where a Calculator Stops
A pressure calculator makes one large assumption: that your tyres are in good condition. It has no way of knowing otherwise.
It cannot see that a casing has taken enough cuts and abrasion to be near the end of its safe life, or that a sidewall has started to craze. It does not know your rim's maximum pressure either — hookless and tubeless setups have hard limits, and where the manufacturer's figure is lower than the calculator's, the manufacturer wins every time.
It also cannot account for the fact that the answer moves. Tubeless tyres lose air steadily between rides. Air pressure shifts with temperature, so a tyre set indoors in the evening reads differently at a cold start line. And a tyre worn thin through the tread crown behaves differently from the new one the calculation assumed.
That is the honest boundary of what a number can do for you: it is right for the tyre you have today, in the condition it is in today.
Pressure Is a Live Number. Wear Is a Lifecycle Number.
The distinction is worth holding onto. Pressure resets every time you use a pump. It is true about right now and says nothing about next month. Wear works the other way round: it accumulates ride after ride, quietly, and it is the thing that eventually determines whether your tyre is still safe to run at any pressure.
That is the part Componentry tracks. Add your tyres as components and every synced ride from Strava, Garmin, Wahoo, or Hammerhead adds to their distance automatically, with no logging on your part. As a tyre approaches the end of the life you have set for it, Componentry prompts the casing and tread inspection that actually decides replacement — the check described in how to tell when your bike tyres are worn out — and the same tracking runs across your chain, cassette, brake pads, and electronic shifting batteries.
Get your pressure from the calculator. Get your replacement timing from the data your rides have already generated.
Further Reading on Tyre Pressure
- SILCA: Tire Pressure Calculator Explained — how the calculator works, what the breakpoint is, and why pump accuracy matters.
- SILCA: The Asymmetric Effects of Tire Pressure — why being under is cheap and being over is expensive, on road and on cobbles.
- SILCA: Part 4B, Rolling Resistance and Impedance — the 2014 road testing the model is built on, with the methodology laid out.
- SILCA Pro Tire Pressure Calculator — the tool itself.
- Bicycle Quarterly: Suspension Losses Confirmed — independent research reaching the same conclusion.
Related Componentry reading:
- Bike Tyre Pressure Calculator — the short version, and a direct link to the tool.
- How to Tell When Your Bike Tyres Are Worn Out (Beyond the Tread) — the casing inspection a pressure number can never do for you.
- Tyre Pressure Sensor Wheels: What Zipp's New Sensor Actually Changes — measuring pressure while you ride, and what it does and doesn't tell you.
- Tire Lifecycle Management: Pressure, Sealant, and Rubber Aging — pressure, sealant, and rubber aging across a tyre's whole life.